The Wembanyama Effect: How Victor Reshapes Every Shot Opponents Take
March 2025
When Victor Wembanyama is on the court, opponents score 9.3 fewer points per 100 possessions. That’s not a typo. The San Antonio Spurs allow a 102.4 offensive rating with Wemby on the floor versus 111.6 with him off it — a gap that would represent the difference between the league’s best defense and a below-average one.
But the box score only tells you that he’s dominant. It doesn’t tell you how. The most interesting thing about Wembanyama’s defense isn’t the shots he blocks — it’s the shots that never happen. Drives abandoned. Lobs rethought. Floaters pulled back. The entire geometry of an opposing offense bends around him.
So what does that distortion actually look like? We built a possession-level dataset of the 2025-26 Spurs season to find out.
How We Measured It
We tagged every possession from 47 Spurs games as “Wemby ON” or “Wemby OFF” using play-by-play substitution data, yielding roughly 2,970 on-court and 3,370 off-court opponent possessions. Each opponent field goal attempt was classified into six shot zones based on court coordinates (restricted area, paint, short mid-range, long mid-range, corner three, above-the-break three) and linked to its corresponding stint.
All rate metrics are reported per 100 possessions to normalize for pace. Statistical significance was assessed via bootstrap confidence intervals: 10,000 resamples of stint-level data, with a metric deemed significant if the 95% interval excludes zero. We filtered garbage time (score margins exceeding 25 points in the final five minutes) to avoid contaminating the signal.
A few caveats upfront: on/off data captures all lineup effects, not just Wembanyama’s individual impact. The Spurs play different lineups and face different game situations when he sits. Still, with nearly 3,000 on-court possessions, the patterns are robust enough to take seriously.
The Shot Displacement Effect
This is the signature of Wembanyama’s defense. Here’s what opponent shot selection looks like with him on the court versus off:
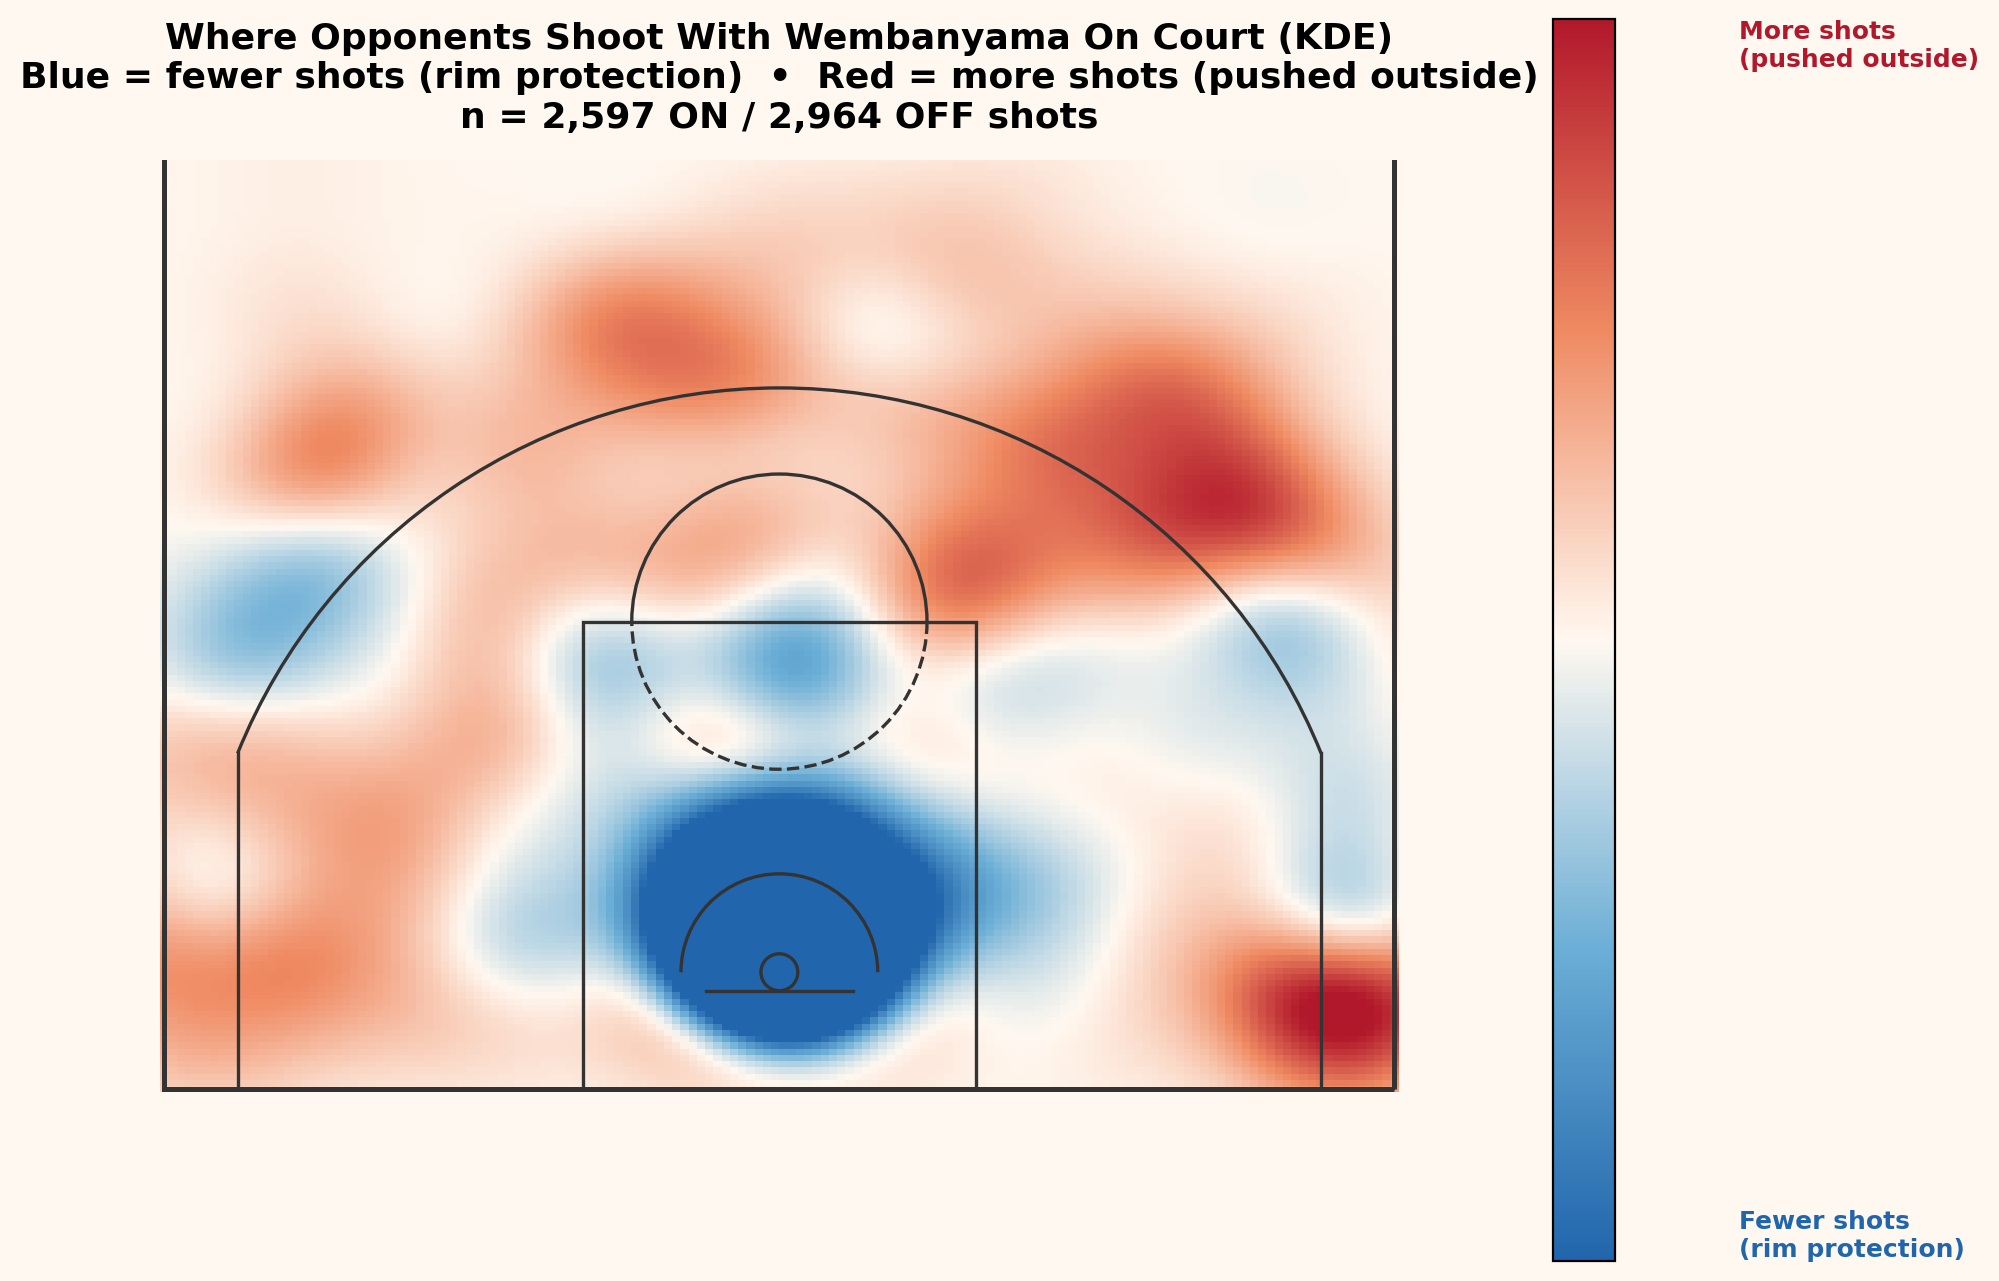 Figure 1: Opponent shot density difference (ON minus OFF). Blue = fewer shots, red = more shots. The restricted area empties out; the perimeter fills up.
The numbers paint a clear picture of displacement:
| Zone | Wemby ON | Wemby OFF | Delta | Significant? |
|---|---|---|---|---|
| Restricted area | 24.0% | 28.7% | -4.6pp | Yes |
| Paint (non-RA) | 8.7% | 11.3% | -2.6pp | Yes |
| Corner three | 12.2% | 10.2% | +2.0pp | Yes |
| Above-the-break three | 31.2% | 26.9% | +4.2pp | Yes |
| Three-point rate (total) | 43.3% | 37.1% | +6.3pp | Yes |
| Average shot distance | 14.7 ft | 13.1 ft | +1.6 ft | Yes |
Every one of these is statistically significant. Opponents take 7.2 percentage points fewer shots in the paint (restricted area + non-RA combined) and 6.3 percentage points more three-pointers when Wemby is on the floor. The average shot moves 1.6 feet further from the basket — the equivalent of turning a floater in the lane into a long two.
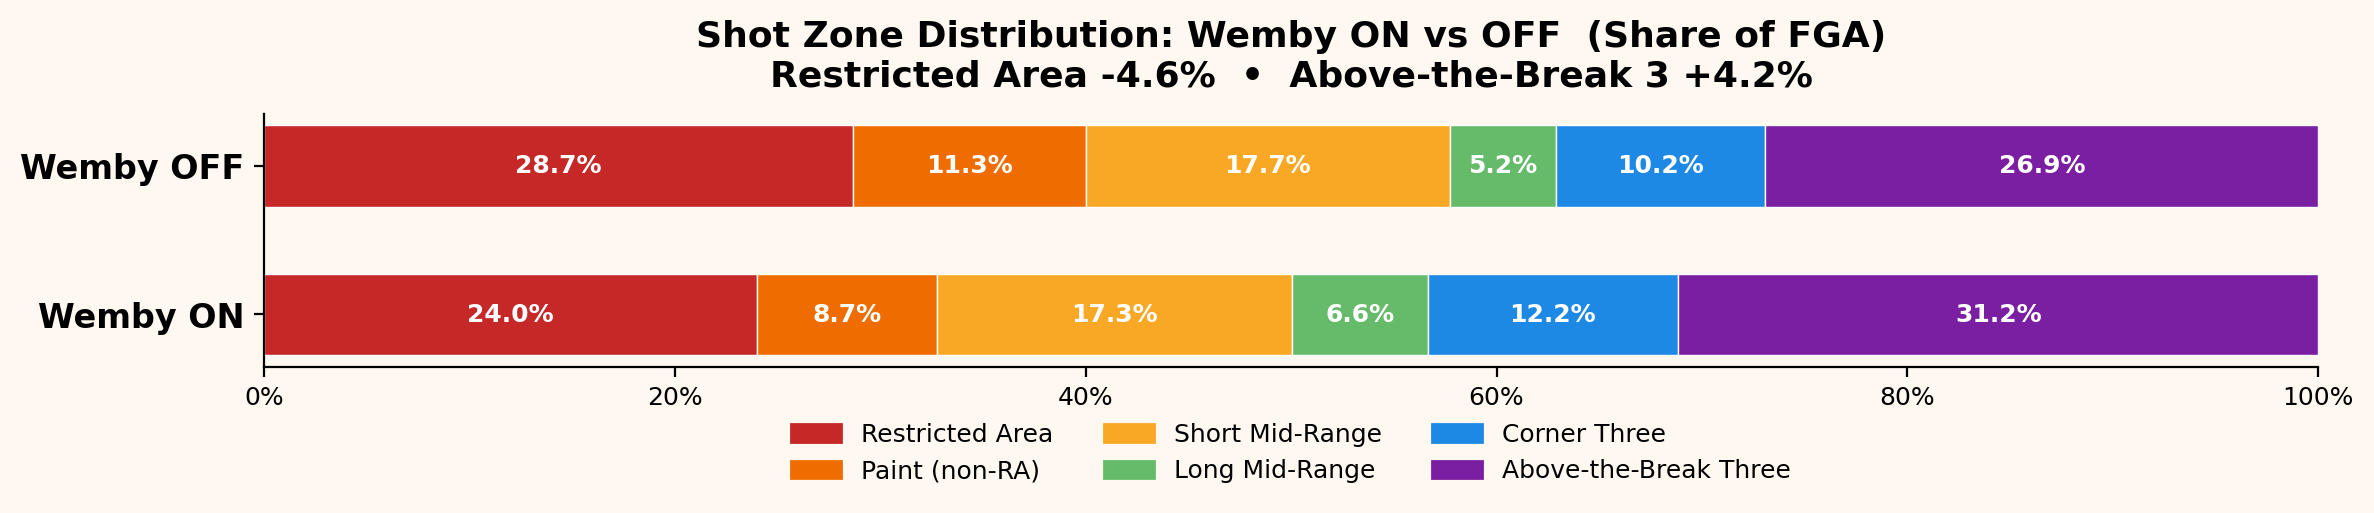 Figure 2: Shot zone distribution, ON vs. OFF. The paint shrinks; the three-point line expands.
This is shot displacement in its purest form. Wembanyama doesn’t just contest shots at the rim — he prevents them from ever being attempted there.
Efficiency Suppression: It’s Not Just the Locations
Here’s where it gets interesting. You might assume that pushing opponents into worse shot locations explains the efficiency drop. It doesn’t — at least, not in the way you’d expect.
The expected effective field goal percentage — based purely on where opponents shoot from — barely changes. It drops just 0.5 percentage points when Wemby is on court, and that difference is not statistically significant. The shot location mix shifts, but the zones opponents migrate to (threes) are efficient enough that the expected value roughly balances out.
Yet actual eFG% craters by 5.0 percentage points (49.5% ON vs. 54.5% OFF, 95% CI: [-8.2, -1.8]). That gap — the difference between expected and actual efficiency — is what we call eFG Points Over Expected (eFGPOE). It swings by 4.5 percentage points and is highly significant.
In other words: Wembanyama doesn’t just push opponents to worse spots. He makes them worse at converting the shots they do take, while simultaneously making his teammates better defenders. Contested looks and drastically altered release points compound on the shooter. But his presence also acts as the ultimate safety net: knowing Wemby has the paint locked down, his teammates can stay glued to perimeter shooters instead of scrambling to help when players cut to the rim.
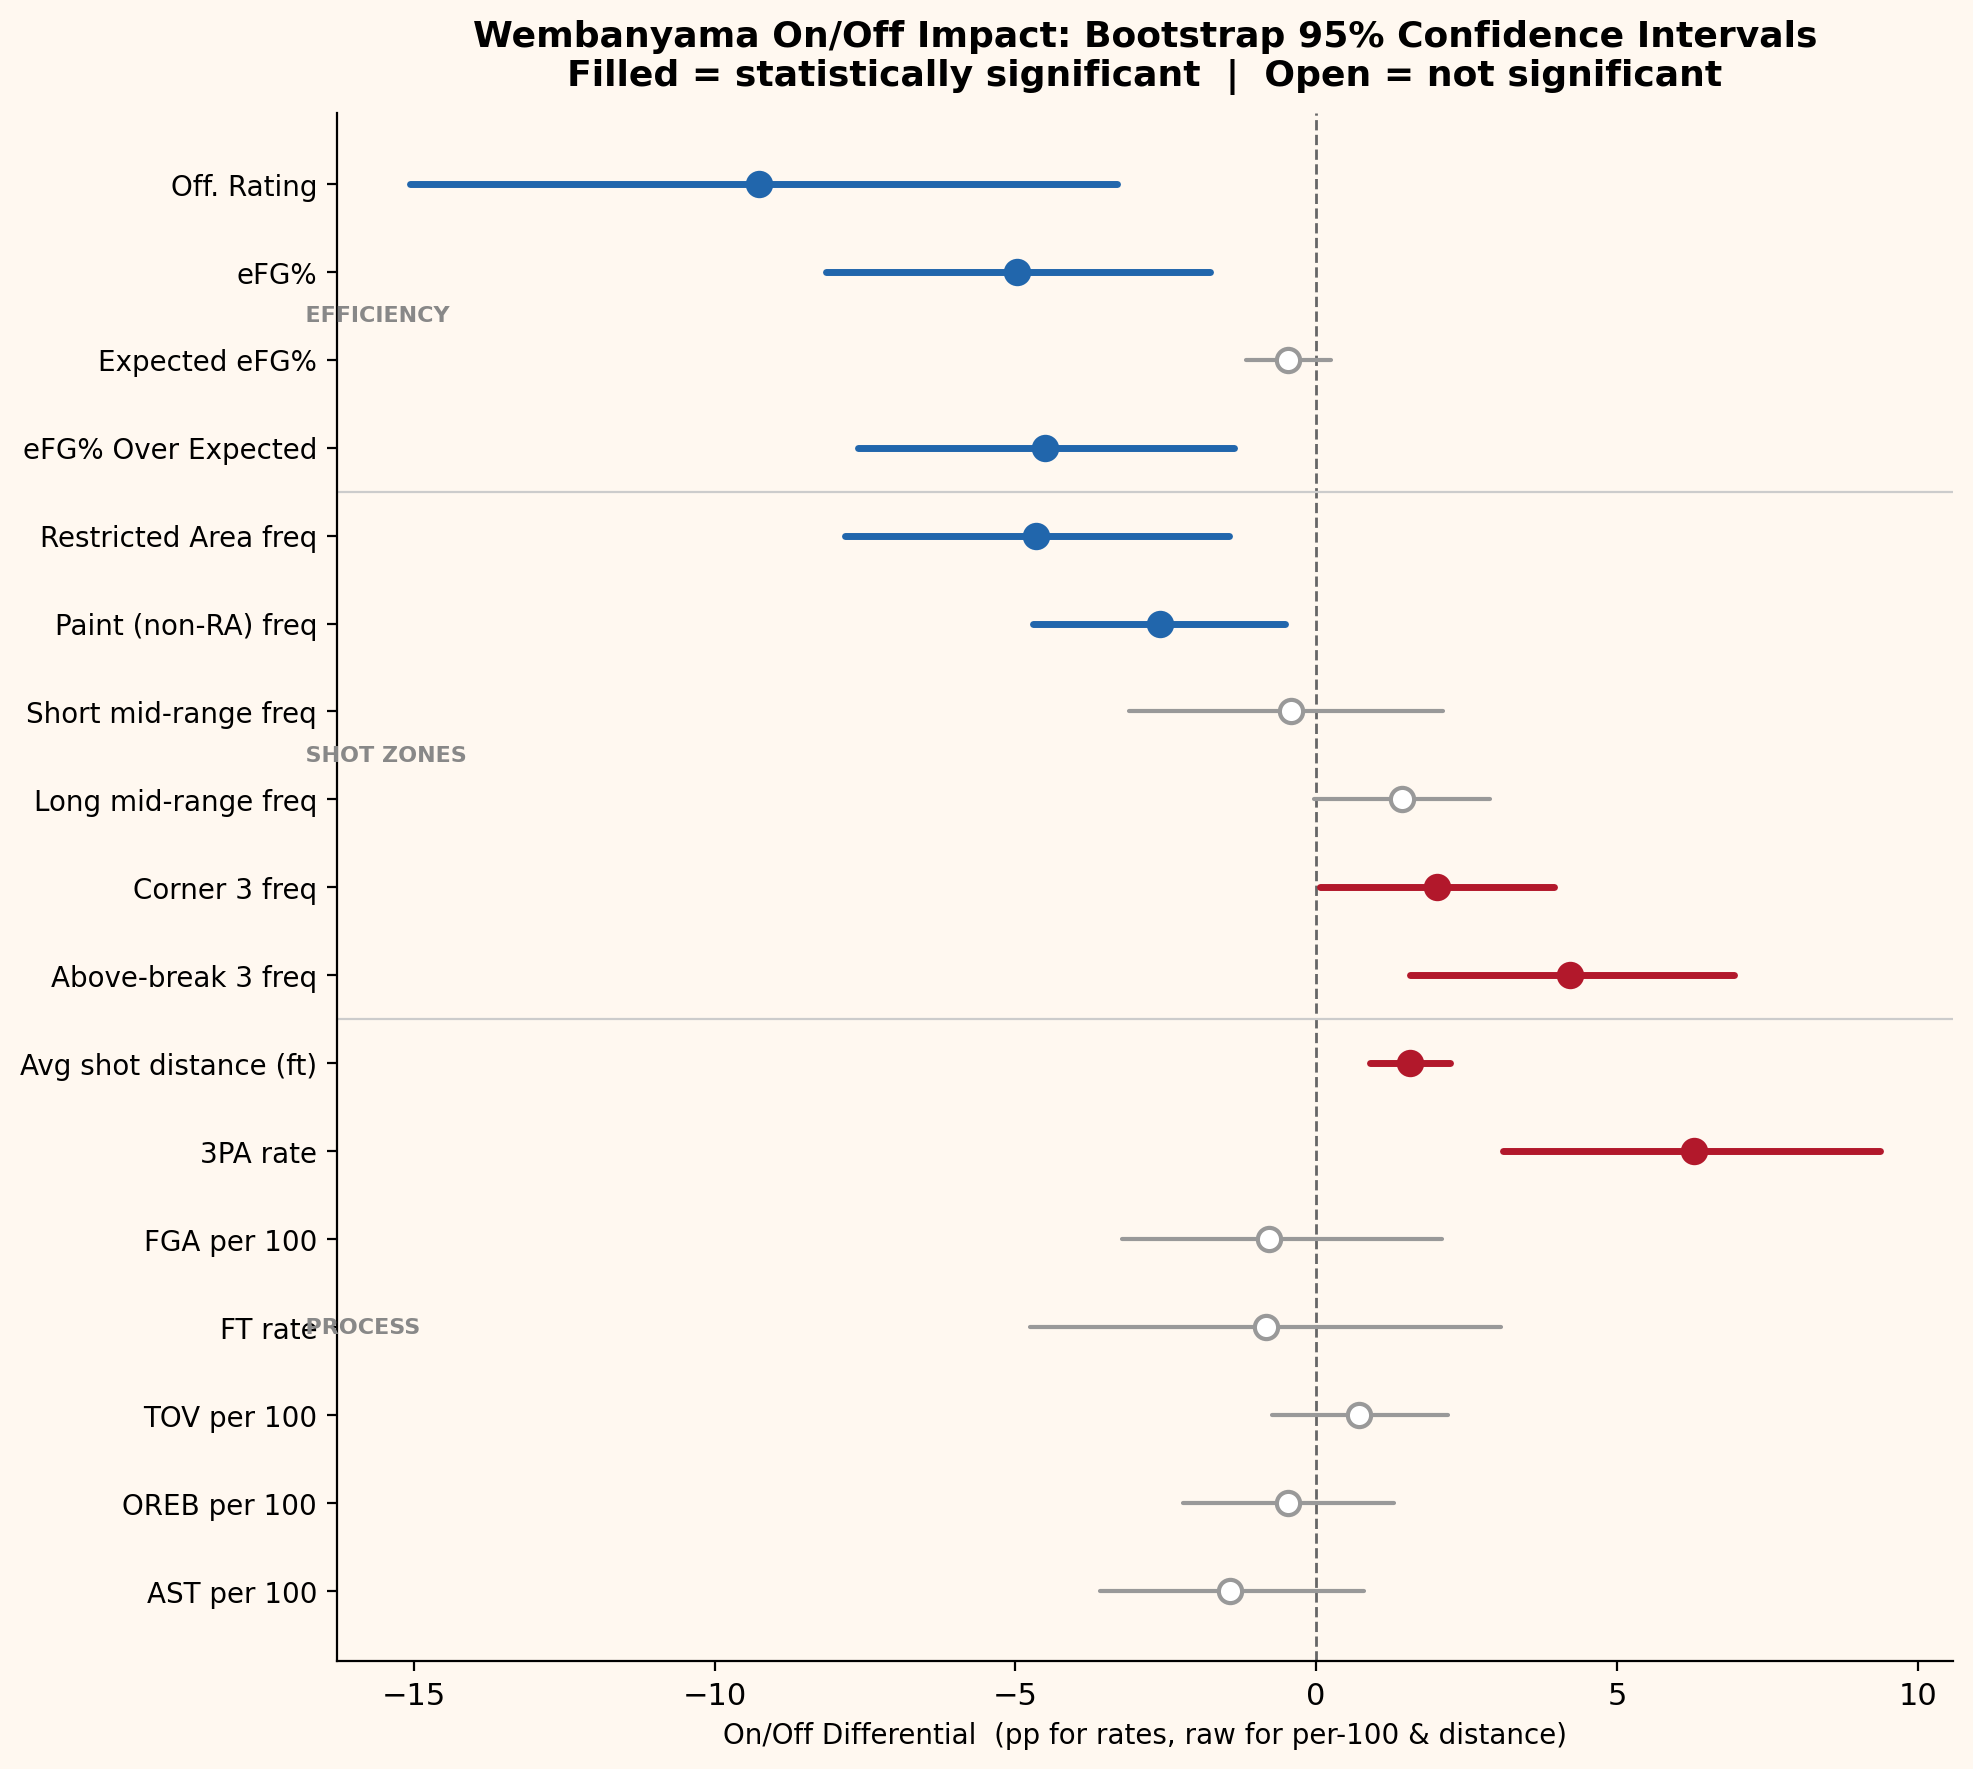 Figure 3: Bootstrap confidence intervals for 17 on/off metrics. Filled markers indicate statistical significance (95% CI excludes zero). Nine of 17 metrics are significant.
Of the 17 metrics we bootstrapped, 9 are significant. All six shot-location metrics, plus eFG%, eFGPOE, and ORtg. The non-significant metrics are telling too: shot volume (FGA per 100), free throw rate, turnover rate, offensive rebounding rate, and assist rate all show no meaningful on/off difference. Wembanyama’s impact is concentrated in where and how well opponents shoot, not in forcing turnovers or preventing trips to the line.
How Teams Adapt (Or Try To)
Not every team responds to Wembanyama the same way. Some displace dramatically but maintain efficiency; others barely adjust and get crushed. We broke the data down by opponent, comparing each team’s shot profile when Wemby is on the floor versus when he’s off.
A caveat: team-level samples are small — roughly 45 to 230 on-court possessions per opponent. These numbers are directional, not definitive. But the patterns are illuminating.
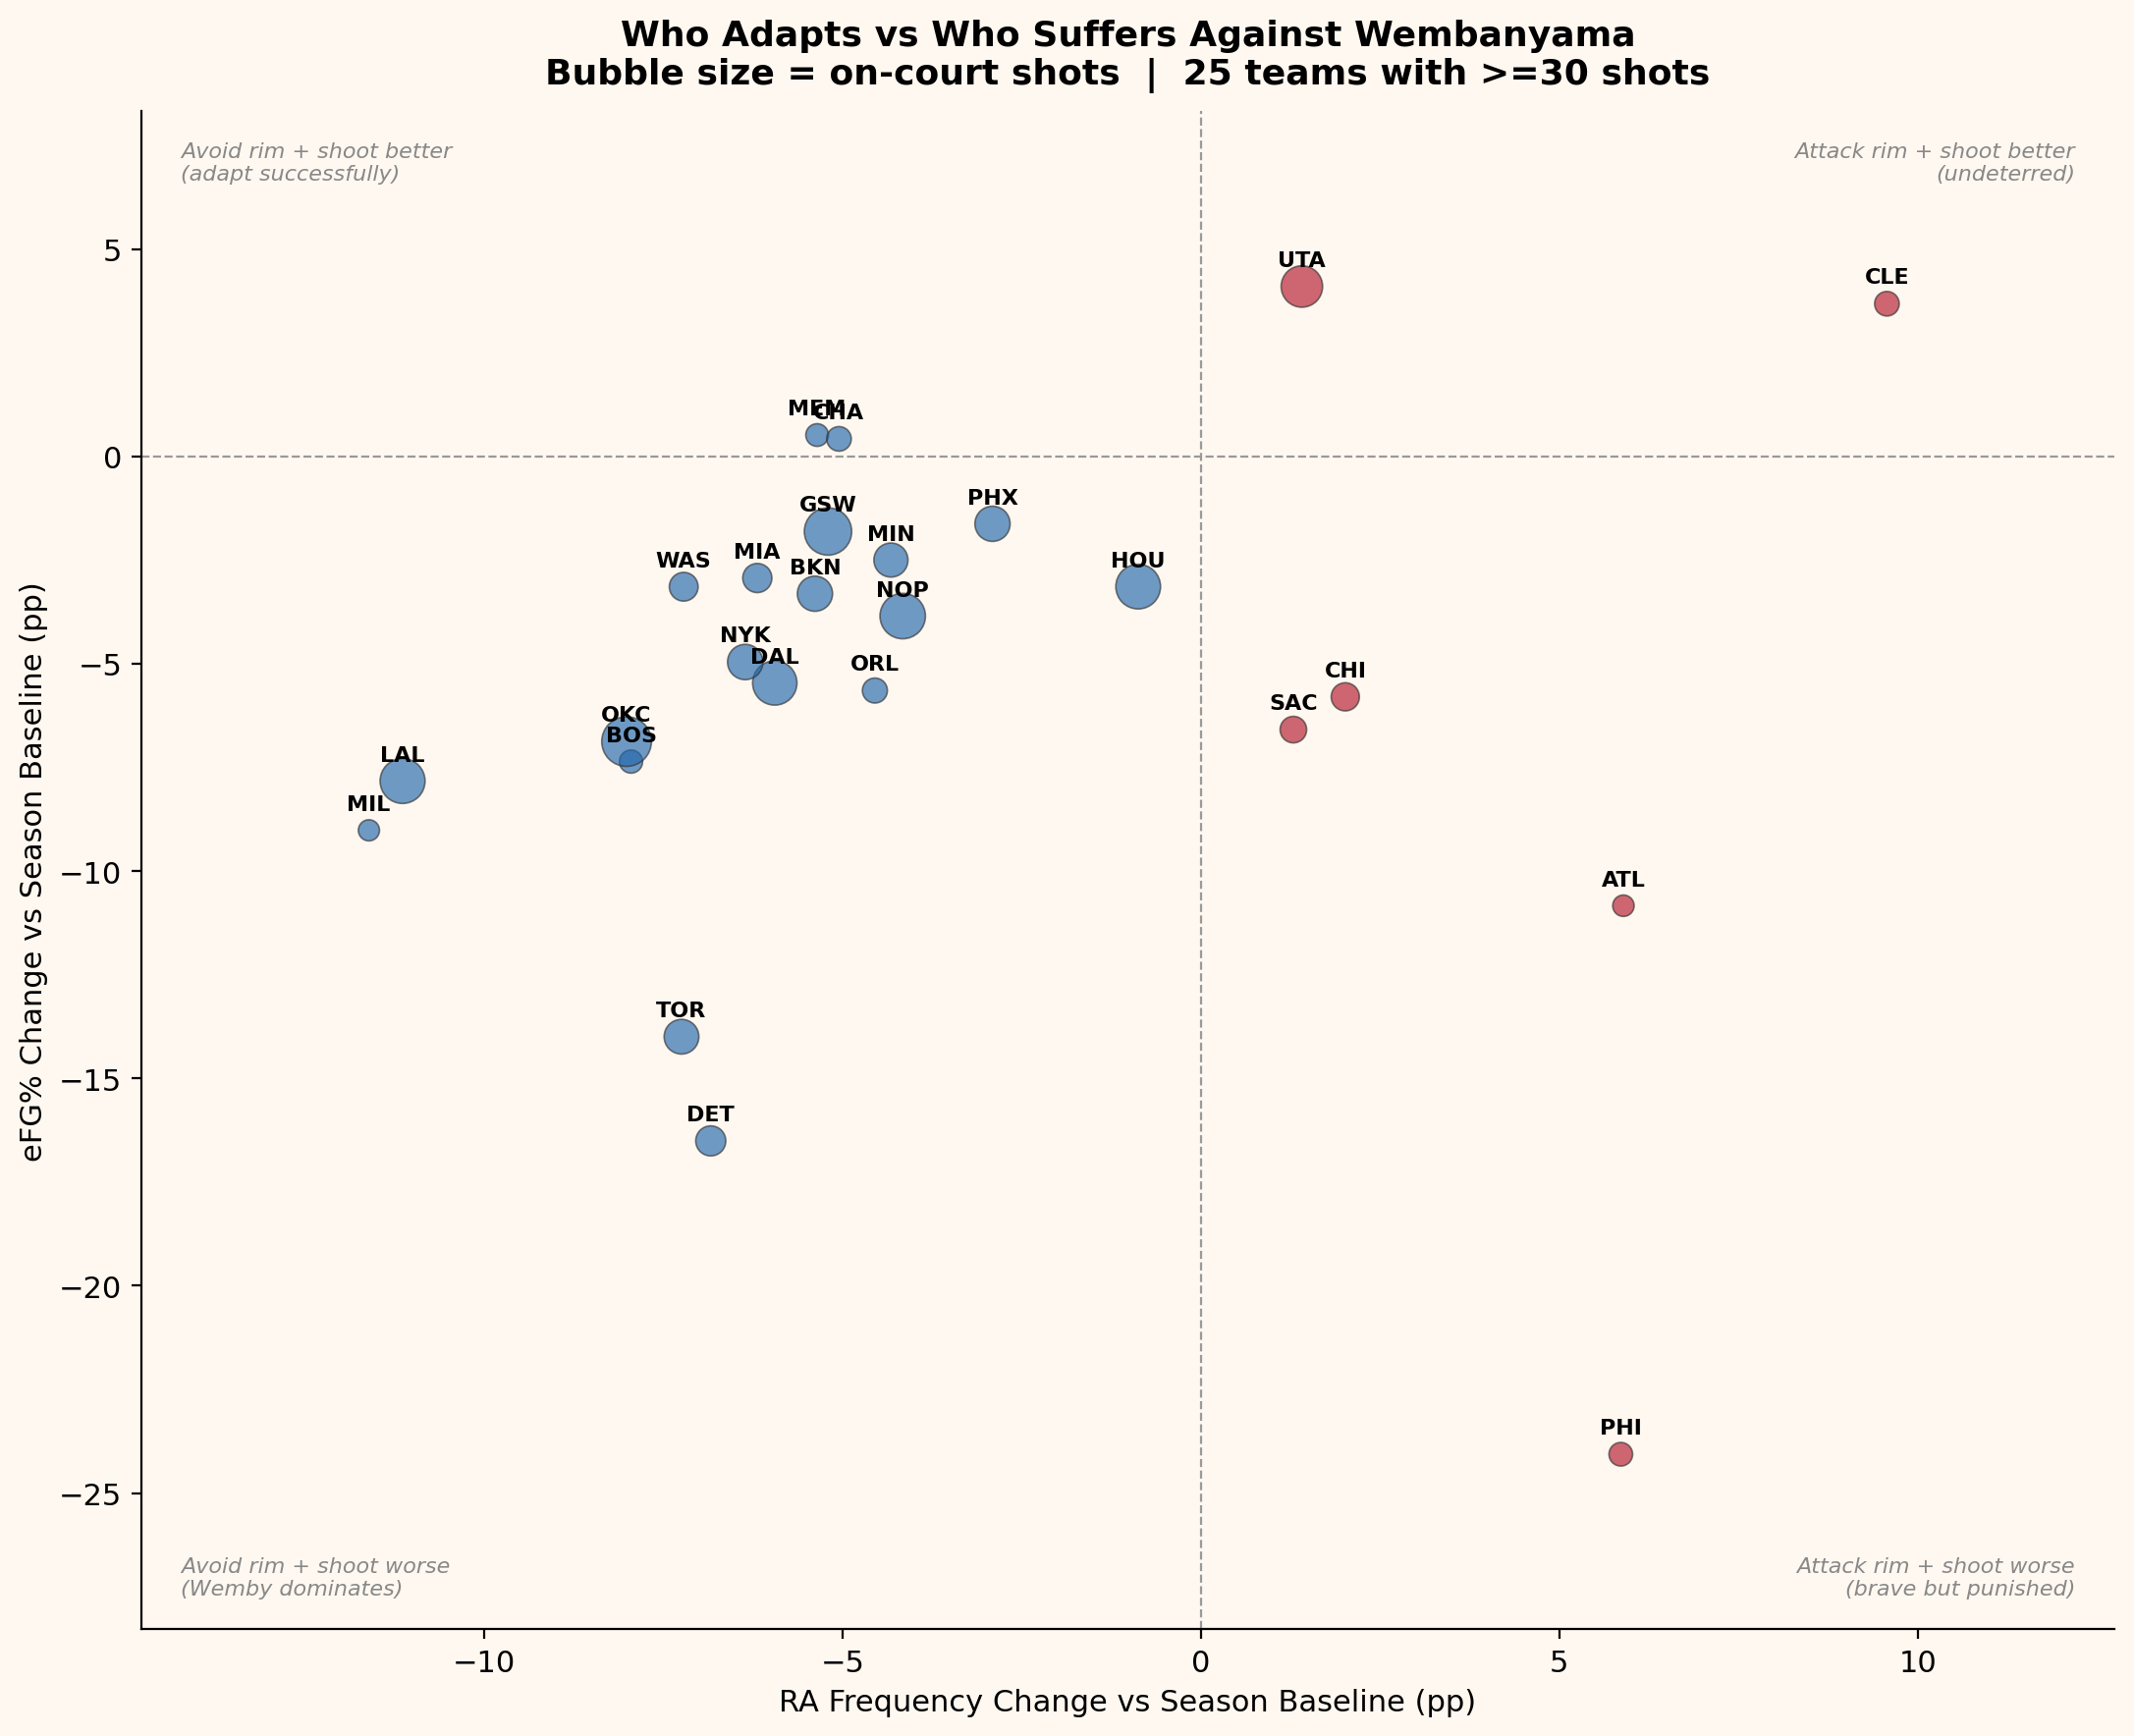 Figure 4: Each team’s restricted area frequency change vs. baseline (x-axis) vs. eFG% change vs. baseline (y-axis) when Wembanyama is on court. Teams in the lower-left avoid the rim AND shoot worse. Teams in the upper-left avoid the rim but maintain efficiency.
The scatter reveals four quadrants of response:
Displaced and suppressed (lower-left): Most opponents land here. They avoid the rim and shoot worse. The Milwaukee Bucks are an extreme case: their restricted area frequency drops 11.6 percentage points below their season baseline, and their eFG% drops 9.0 percentage points. They’re pushed out of the paint and still can’t convert.
Displaced but resilient (upper-left): The Golden State Warriors are the textbook example. Their restricted area frequency drops 5.2 percentage points below baseline — clear displacement. But their eFG% only drops 1.8 percentage points. Golden State’s perimeter shooting infrastructure partially absorbs the Wembanyama effect — when you push the league’s best three-point shooting team to the arc, they can still make you pay.
Suppressed without displacement (lower-right): A few teams attack the rim at or above their usual rate but still see efficiency drops. This suggests Wembanyama’s contest and intimidation effects work even when the shot profile doesn’t shift much.
The outliers: Philadelphia and Toronto show extreme eFG% swings (-24.1pp and -14.0pp respectively), but both have very small on-court samples (50 and 108 shots). These are noise, not signal — treat them as directional at best.
What It All Adds Up To
Wembanyama’s defensive impact operates through two distinct and reinforcing channels. First, displacement: opponents take 7.2 fewer percentage points of their shots in the paint and 1.6 feet further from the basket on average. Second, suppression: even accounting for those location changes, opponents convert at significantly lower rates, with eFGPOE swinging by 4.5 percentage points.
Nine of the 17 metrics we tested reach statistical significance, and they tell a coherent story. What’s not significant matters too — Wembanyama’s on/off splits show no meaningful difference in turnover rate, free throw rate, or shot volume. This isn’t a “does everything” defensive profile. It’s a specific, measurable gravitational field that warps where and how opponents shoot.
For the Defensive Player of the Year conversation, the case writes itself: a 9.3-point swing in offensive rating, backed by displacement and suppression effects that survive bootstrap testing across nearly 3,000 possessions. In a league that increasingly revolves around rim pressure and three-point efficiency, Wembanyama is the most disruptive force in the sport.
Methodology Appendix
Data sources, formulas, and technical details
Data Sources
- Play-by-play: NBA Stats API (
PlayByPlayV3), 47 Spurs games, 2025-26 season - Shot locations:
ShotChartDetailendpoint, all opponent shots vs. Spurs - Season baselines: Full-season opponent shot data for each team (via
DomSamangy/NBA_Shots_04_25)
Possession Formula
Possessions = FGA - OREB + TOV + 0.44 x FTA
On/Off Framework
Every play-by-play event is tagged with Wembanyama’s on/off status using substitution tracking. Stints are defined as continuous stretches between substitutions. Metrics are aggregated at the stint level, then combined for league-wide and team-level analysis.
Garbage Time Filter
Stints occurring with a score margin exceeding 25 points in the final 5 minutes of any period are excluded.
Bootstrap Confidence Intervals
- 10,000 resamples of stint-level data (resampling ON stints)
- 95% confidence intervals reported
- A metric is “significant” if its 95% CI excludes zero
- Note: this is a one-sample bootstrap of on-court stint variation, not a two-sample test
Shot Zone Definitions
| Zone | Definition |
|---|---|
| Restricted area | Distance from basket <= 4 feet |
| Paint (non-RA) | 4-8 feet from basket |
| Short mid-range | 8-16 feet |
| Long mid-range | 16 feet to three-point line |
| Corner three | |x| >= 220 and y <= 89 (in tenths of feet) |
| Above-the-break three | Beyond arc, excluding corners |
Distance from basket = sqrt(LOC_X^2 + LOC_Y^2) / 10
Sample Sizes
- ON-court possessions: ~2,970
- OFF-court possessions: ~3,370
- Team-level ON possessions: 45-230 per opponent (directional only)